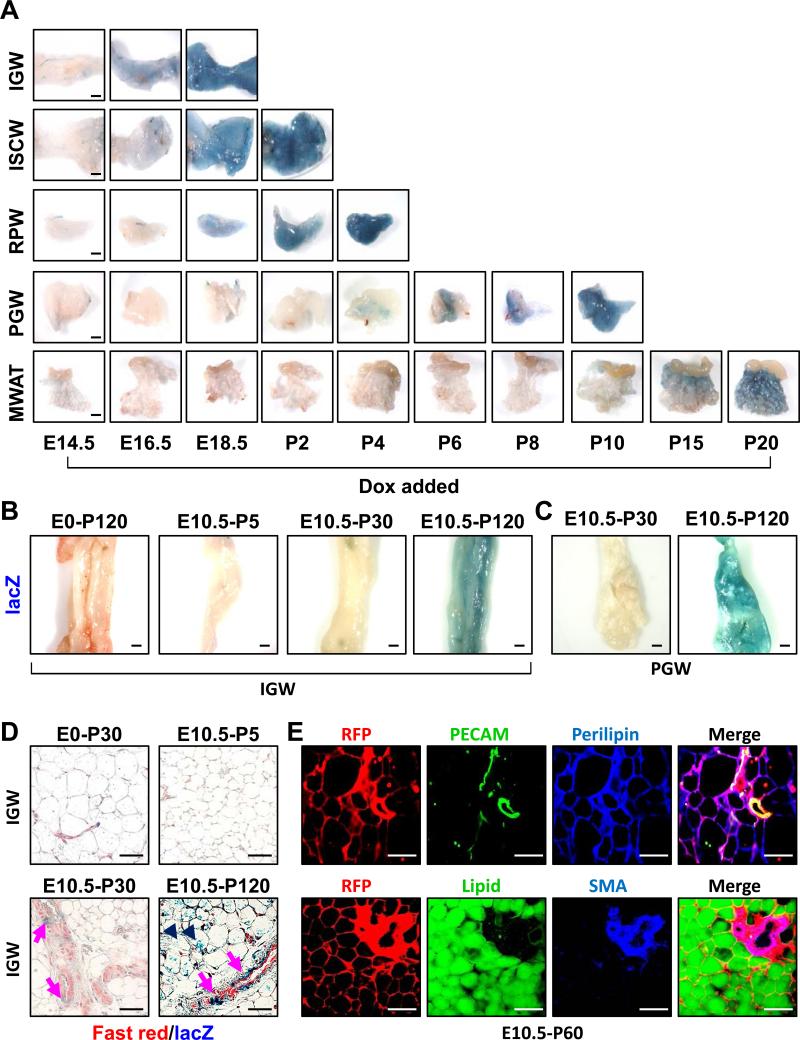
Figure 6. Temporal course of AdipoTrak labeling of adipose progenitors.
A) AdipoTrak, R26RlacZ mice were Dox suppressed at the denoted times and each adipose depot was analyzed at P30 for β-galactosidase activity. B-C) AdipoTrak, R26RlacZ mice were Dox suppressed at the indicated times (E0 = pre-conception, or E10.5) and SQ depots (B) examined at P5, P30 or P120 or perigonal adipose depot (C) examined at P30 or P120 for β-galactosidase activity. D) AdipoTrak, R26RlacZ mice were Dox suppressed from E0 to P30 (control) or from E10.5 to P5, P30, and P120 and adipose depots were stained with X-gal, sectioned and stained with Nuclear Fast Red. Arrows indicate AdipoTrak cells that were marked by E10.5 and present in adult adipose depot vessels; arrowheads indicate X-gal labeled adipocytes that derived from cells marked by E10.5. E) Immunfluorescence images of adipose depot sections of AdipoTrak R26RRFP mice that were Dox suppressed from E10.5-P60 and visualized for RFP (AdipoTrak lineage) and co-stained with either PECAM or LipidTox (green) and Perilipin or SMA (blue). Scale = 200 μm.

