Figure 3.

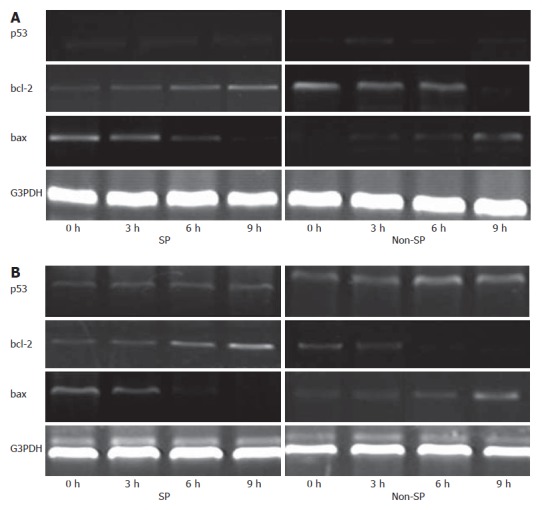
p53, bcl-2 and bax mRNA levels were evaluated by RT-PCR. bcl-2 levels were up-regulated in SP cells from MHCC97 (A) and hHCC (B) cell lines, and bax levels were down-regulated in non-SP cells during denutrition.

p53, bcl-2 and bax mRNA levels were evaluated by RT-PCR. bcl-2 levels were up-regulated in SP cells from MHCC97 (A) and hHCC (B) cell lines, and bax levels were down-regulated in non-SP cells during denutrition.