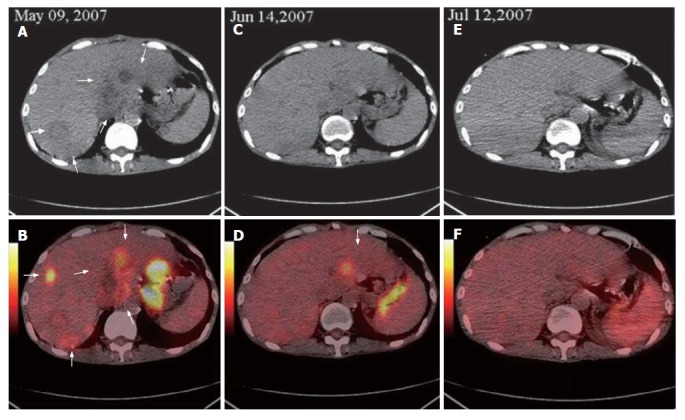
Figure 1.

Base line FDG PET/CT detecting a highly metabolic metastasis in liver (white arrows, A and B), second FDG PET/CT demonstrating the decreased number and metabolism level of liver metastases and one highly metabolic metastasis in the left lobe of liver (white arrows, C and D), third FDG PET/CT displaying no lesion at the same position (E and F).
