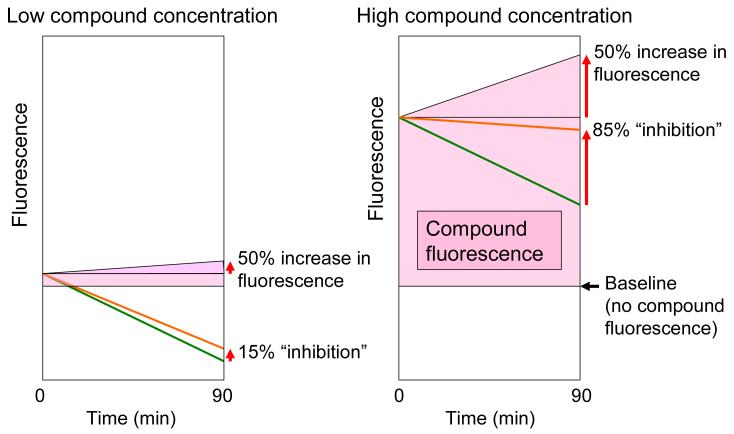
Figure 7.
The effect on the NADPH assay of change in compound fluorescence over time increases with compound concentration. The percent increase in compound fluorescence is independent of compound concentration; thus the absolute fluorescence change increases with increasing concentration. The concentration of NADPH is fixed, so the fluorescence decrease due to enzymatic conversion of NADPH does not change from well to well. Therefore, as the concentration of a fluorescent compound is increased, the magnitude of its fluorescence “drift” relative to the decrease in NADPH fluorescence becomes larger, resulting in a dose-dependent increase in “inhibition”. Both Panels. The purple shaded area represents compound fluorescence, which increases the total fluorescence above the baseline fluorescence in the absence of added compound as shown. The green line represents the decrease in NADPH fluorescence over time. The fluorescence measured in the assay (shown as an orange line) is the sum of the fluorescence due to NADPH and the compound fluorescence. As an illustrative example, compound fluorescence is shown increasing by 50% over the course of the 90 min assay. Left-hand Panel. At low compound concentration, a 50% increase in compound fluorescence partially offsets the decrease in NADPH fluorescence, resulting in apparent 15% inhibition of NADPH conversion. Right-hand Panel. At high compound concentration, a 50% increase in compound fluorescence almost entirely offsets the decrease in NADPH fluorescence, resulting in apparent 85% inhibition of NADPH conversion.

