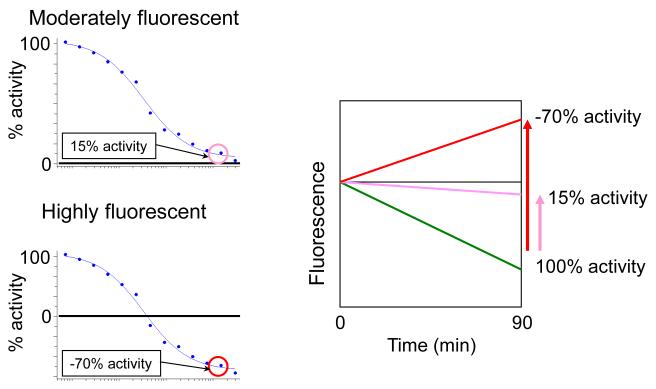
Figure 8.
Upper Left-hand Panel. A moderately fluorescent compound gives a dose response curve similar to that of a bona fide enzyme inhibitor. Lower Left-hand Panel. A highly fluorescent compound gives rise to an increase in fluorescence larger than the decrease in NADPH fluorescence, giving apparent negative percent activity at a high concentration of compound. Right-hand Panel. Decrease in NADPH fluorescence over time is shown by a green line. In the presence of a high concentration of the moderately fluorescent compound giving the dose-response curve shown in the Upper Left-hand Panel, increase in compound fluorescence over the course of the assay offsets the decrease in NADPH fluorescence to the extent that the amount of NADPH conversion over 90 min is reduced to 15% of the conversion in the absence of added compound (see purple line labeled 15% activity). (See Figure 7 for further explanation of this effect.) In the presence of the highly fluorescent compound giving the dose-response curve shown in the Lower Left-hand Panel, increase in compound fluorescence over the course of the assay is greater in magnitude than the decrease in NADPH fluorescence, giving an overall increase in fluorescence over the course of the assay. Calculation of percent activity from a fluorescence increase using Equation 1 gives a negative value, in this case apparent −70% activity at a high compound concentration (see red line labeled −70% activity). Negative percent activity values (and the corresponding percent inhibition values >100 calculated using Equation 2) are not meaningful in the context of bona fide enzyme inhibition. Therefore, the appearance of a dose-response curve such as the one shown in the Lower Right-hand Panel immediately suggests that the compound “activity” is an artifact of its intrinsic fluorescence.

