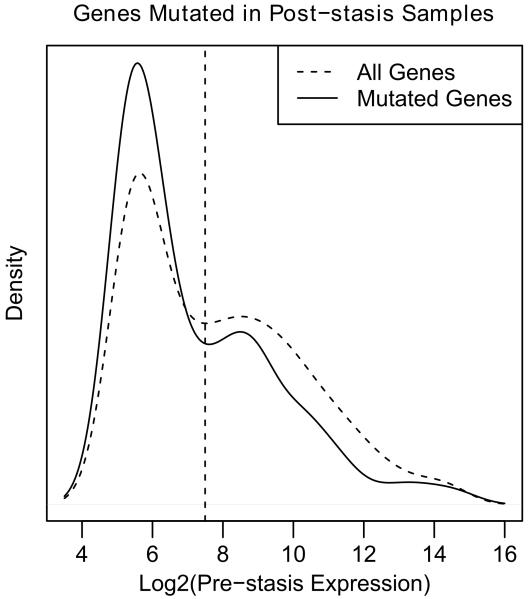
Figure 3.
Distribution of pre-stasis expression levels for all genes and genes that were found mutated in post-stasis cell. The dashed curve shows the expression profile and the dashed vertical line the median of all genes on the Affymetrix HT HG U133A array (14732). The solid curve shows the genes that are mutated in post-stasis cells (348 with expression data).

