Figure 2.

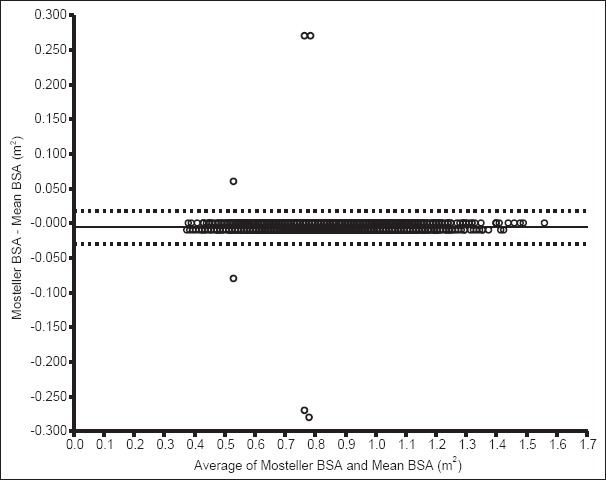
Bland–Altman bias plot for difference between estimate from Mosteller formula and mean body surface area. This plot shows the mean bias (solid line) and 95% limit of agreement

Bland–Altman bias plot for difference between estimate from Mosteller formula and mean body surface area. This plot shows the mean bias (solid line) and 95% limit of agreement