. 2014 Nov-Dec;4(6):943–948. doi: 10.4103/2141-9248.144921
Copyright: © Annals of Medical and Health Sciences Research
This is an open-access article distributed under the terms of the Creative Commons Attribution-Noncommercial-Share Alike 3.0 Unported, which permits unrestricted use, distribution, and reproduction in any medium, provided the original work is properly cited.
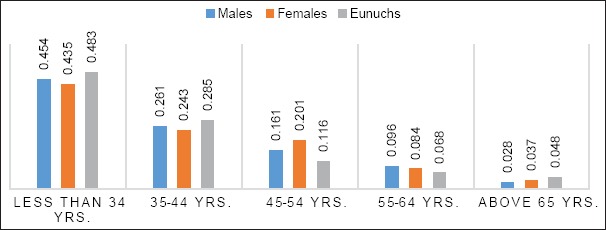
Graph 2.

Distribution of subjects according to age groups
