
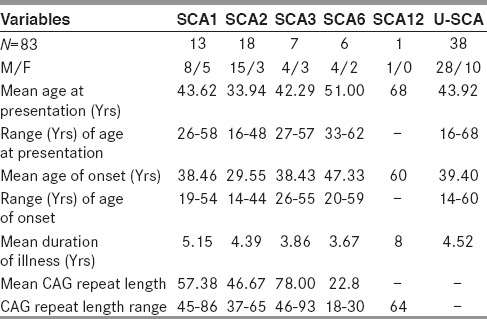
Table 2.
Demographic and classification after genotyping at SCA1, SCA2, SCA3, SCA6 and SCA12 loci
Official websites use .gov
A
.gov website belongs to an official
government organization in the United States.
Secure .gov websites use HTTPS
A lock (
) or https:// means you've safely
connected to the .gov website. Share sensitive
information only on official, secure websites.
Demographic and classification after genotyping at SCA1, SCA2, SCA3, SCA6 and SCA12 loci