Figure 4.

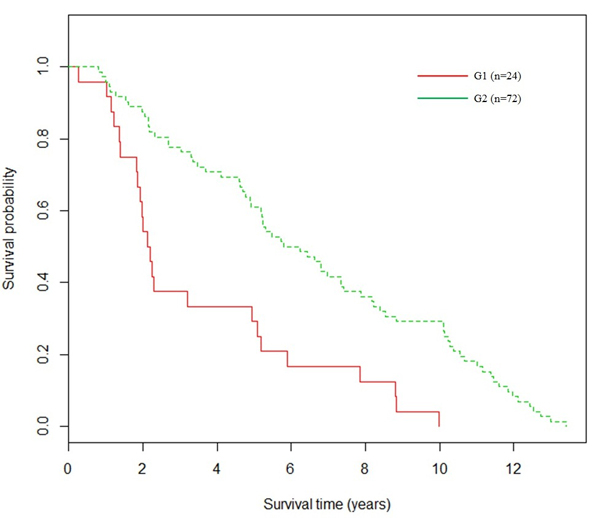
Survival analysis of the breast cancer dataset k was set as 2. The two subgroups were represented by two colors, respectively. The p-value of the logrank test for difference among the two subgroups was 4.6e-5.

Survival analysis of the breast cancer dataset k was set as 2. The two subgroups were represented by two colors, respectively. The p-value of the logrank test for difference among the two subgroups was 4.6e-5.