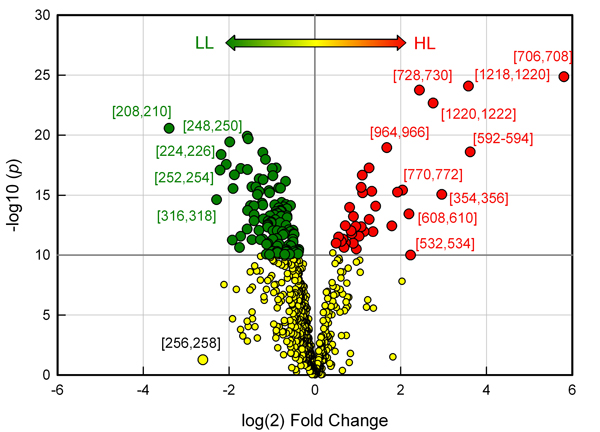
Figure 9.

Volcano plot of bin results comparing HL and LL samples. Green symbols indicate mass bins that were significantly downregulated while red symbols indicate mass bins that were significantly upregulated in HL samples (p<1e-10). Significant bins that were upregulated or downregulated by at least 4-fold are indicated.
