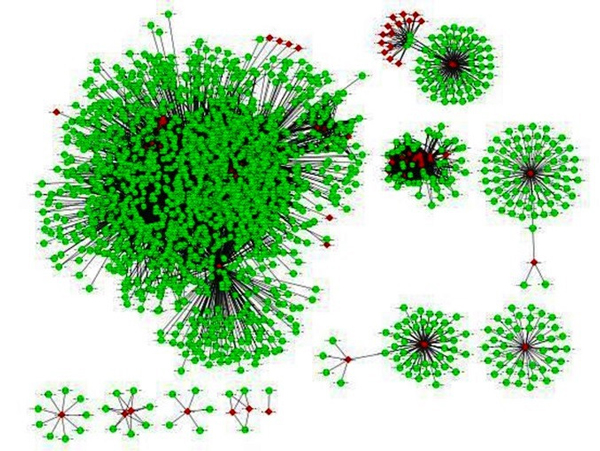
Figure 3.

Visualization of the predicted protein-protein interactions between Arabidopsis thaliana and Pseudomonas syringae. Each node represents a protein and each edge refers an interaction. Green color circles represent Arabidopsis and red color diamonds represent Pseudomonas. The network is generated using the Cytoscape tool.
