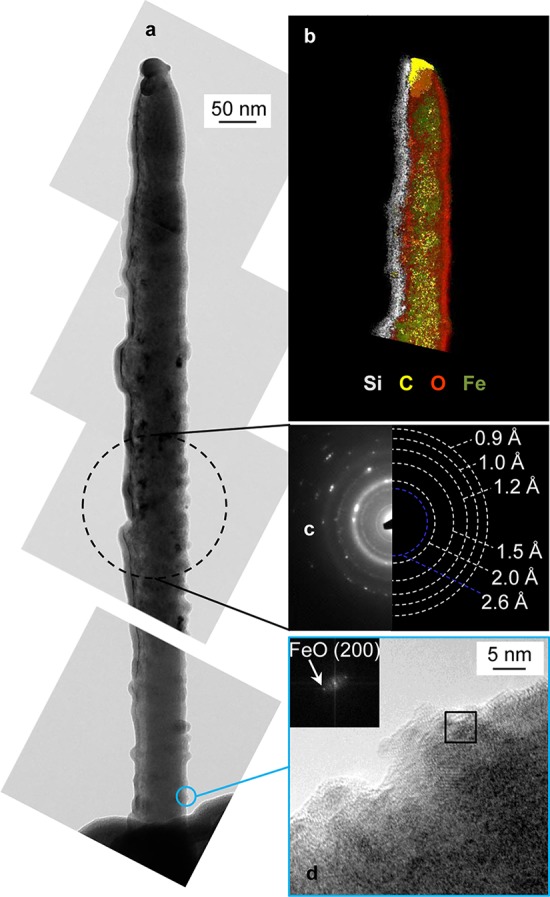
Figure 2.

TEM analyses of an Fe needle deposited on a commercial AFM tip. (a) TEM micrographs displaying an overview of the Fe needle along its height. (b) EFTEM elemental mapping of the needle tip. The Fe core is covered by a thin oxide layer (∼5 nm), while C is distributed throughout the whole structure. The presence of Si on the side of the needle is due to redeposition from the FIB-milling during the sample preparation. (c) Diffraction pattern of the needle, which mainly shows α-Fe and bcc-FeO polycrystalline phases (white dashed lines). Traces of fcc-Fe3O4 (blue dashed line) are also present. (d) HR-TEM micrograph showing that the thin oxide layer mainly consists of FeO.
