
Figure 4.
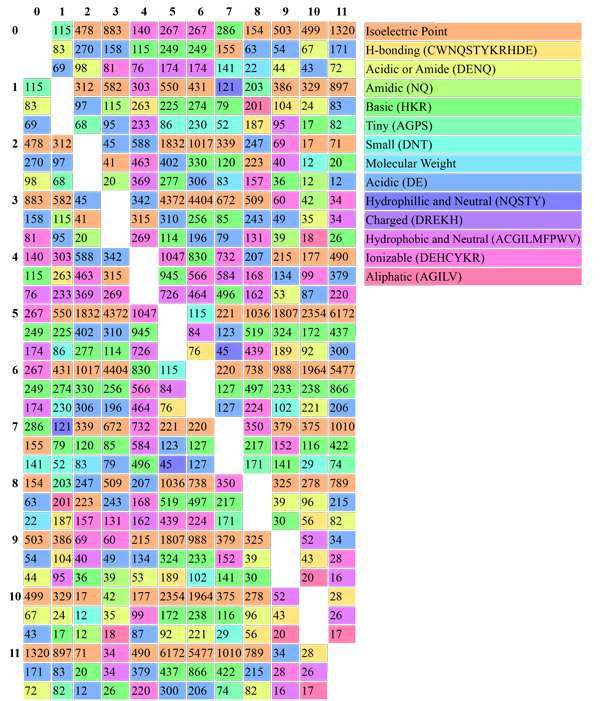
Distribution of best three physicochemical properties between each class for the classes generated by LacSubPred. The numbers represent the ANOVA score. Larger numbers indicate stronger correlations between classes. This indicates the best features and extent to their contribution for the distinction between the classes.