
Figure 7.
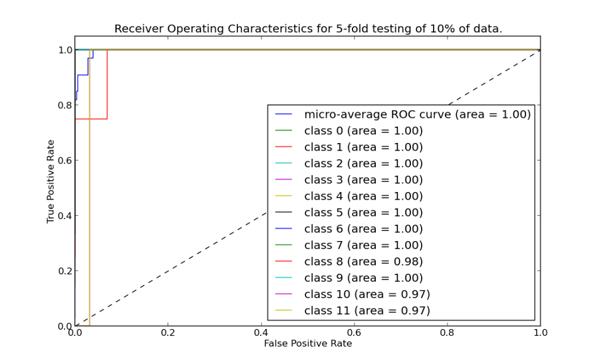
ROC curves of different classes generated from the best model (physiochemical model) in an independent test. Area under curve for each enzyme subtype is also depicted.
Official websites use .gov
A
.gov website belongs to an official
government organization in the United States.
Secure .gov websites use HTTPS
A lock (
) or https:// means you've safely
connected to the .gov website. Share sensitive
information only on official, secure websites.
ROC curves of different classes generated from the best model (physiochemical model) in an independent test. Area under curve for each enzyme subtype is also depicted.