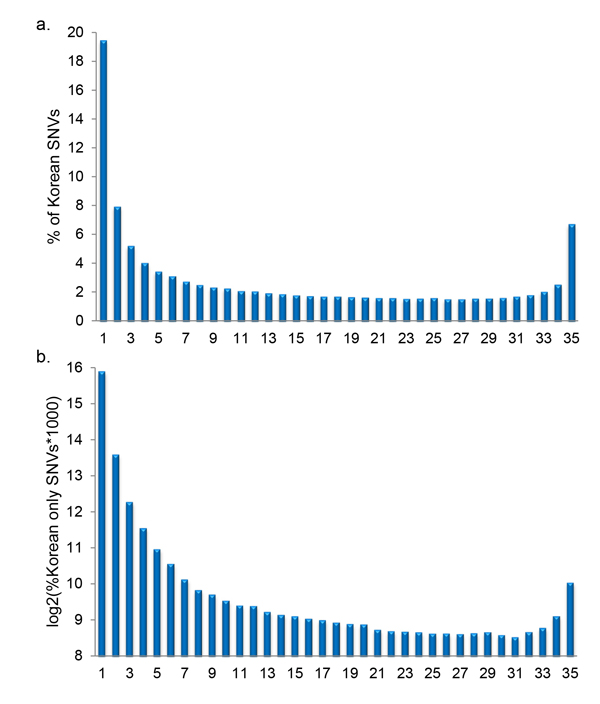
Figure 2.

Frequency distribution of Korean SNVs and Korean only SNVs. Frequency distributions in terms of occurrences in the population were calculated and plotted for Korean SNVs (a) and Korean only SNVs (b). The x-axis indicates the occurrences and the y-axis gives the corresponding SNV frequency in %.
