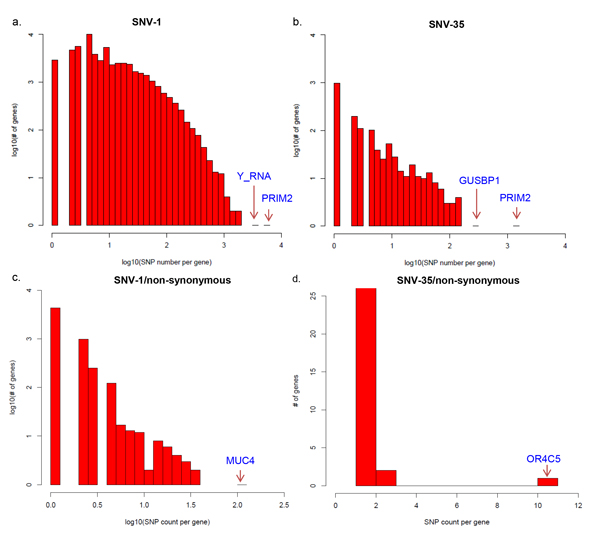
Figure 5.

Distribution of count of Korean SNVs per gene. The count of SNVs per gene was calculated for SNVs in SNV-1 (a), SNV-35 (b), SNV-1/ns (c) and SNV-35/ns (d). Top one or two ranked genes were labeled. The x-axis indicates SNVs per gene in log10 transformation and the y-axis depicts number of genes.
