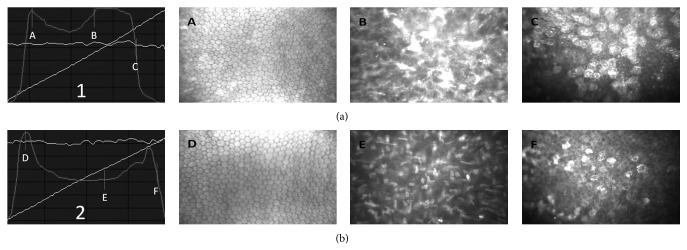
Figure 2.

In vivo confocal microscopy images obtained with the scanning slit confocal microscopy 1 month after accelerated cross-linking (a) and normal cornea (b); (1): backscatter light intensity depth graph of cross-linked cornea; A: endothelium, B: demarcation line, C: epithelium, distance between B and C: depth of the demarcation line, (2): backscatter light intensity depth graph of normal cornea, D: endothelium, E: midstroma, and F: epithelium.
