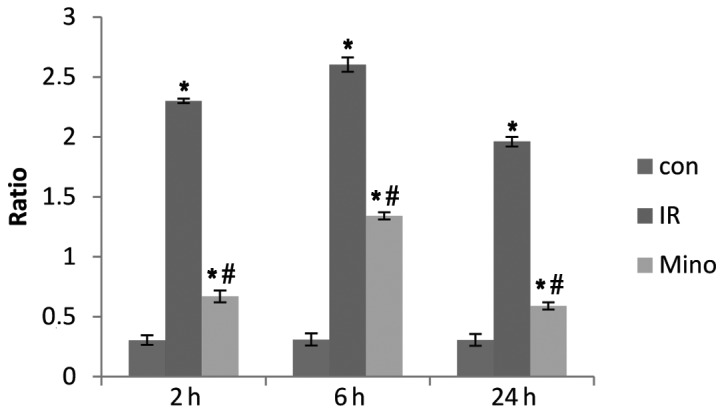
Figure 2.

Expression of tumor necrosis factor-α mRNA in the liver tissues of each group after reperfusion for 2, 6 and 24 h. Con, control sham-operated group; I/R, ischemia/reperfusion; Mino, minocycline. *P<0.05 vs. control group; #P<0.05 vs. I/R group. β-actin mRNA was considered as the internal control.
