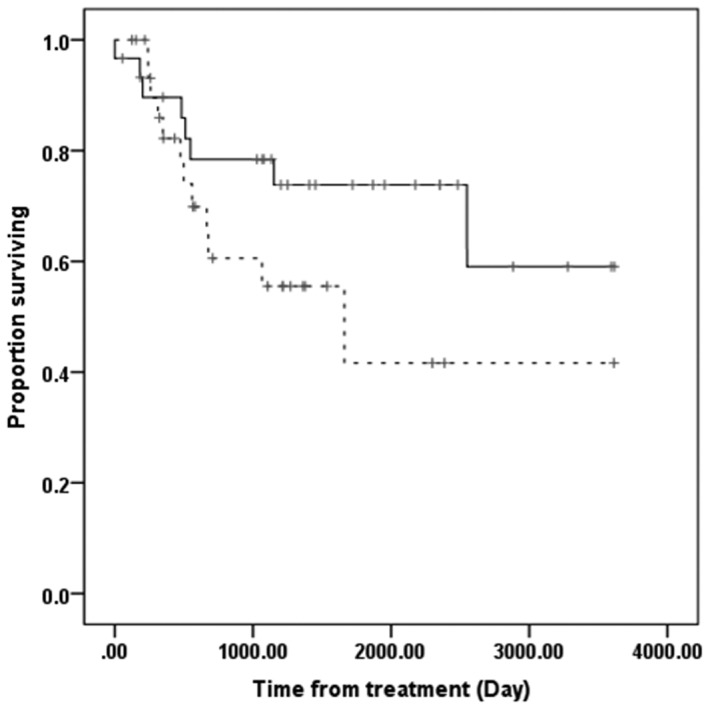
Figure 4.

Overall survival rate in the low (n=30) and high SIRT1 expression (n=32) groups. Solid line, low SIRT1 expression; dashed line, high SIRT1 expression. There was no significant difference in overall survival between the two groups (P=0.143, Kaplan-Meier and log-rank tests). SIRT1, sirtuin1.
