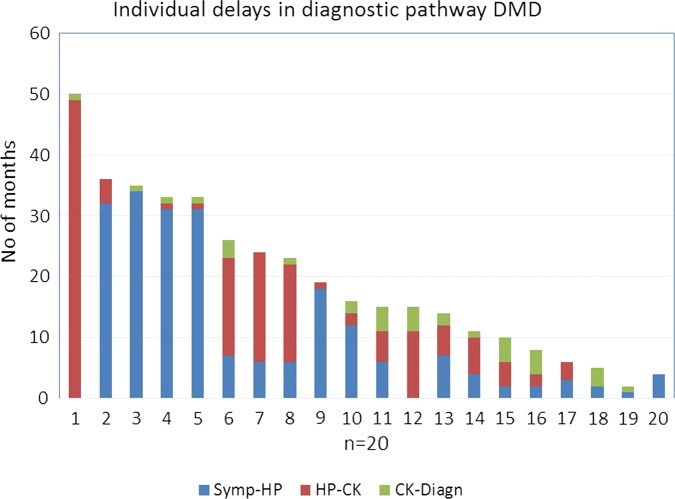
Figure 1.
Display of individual delays in diagnostic pathway Duchenne muscular dystrophy (DMD). The X-axis displays each individual boy (n=20). The Y-axis represents the total delay (in months) for each boy from first reported symptoms (time 0 on Y-axis) to diagnosis. This total delay is divided into three parts. The blue part of the column is the delay from first reported symptoms to visiting a health professional (Symp-HP), the red part is the delay from visiting a health professional to the creatine kinase test (HP-CK) and the green part is the delay between CK test and the diagnosis of DMD (CK-Diagn).

