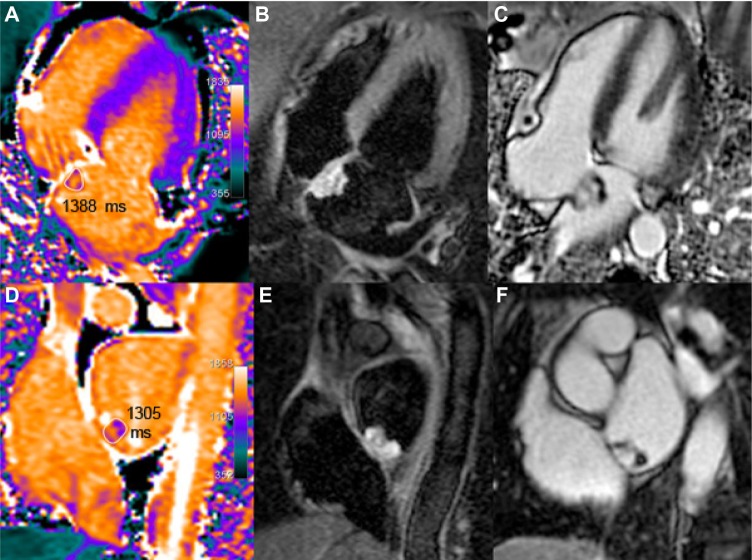
Figure 14.
Left atrial myxoma in a 60-year-old female. In the T1 maps (A, D), the T1 value of the tumor is increased (≈1350 ms, ie, +25% or +6.9 SD as compared with the septum). High signal of the mass is seen on the corresponding STIR-T2 images (B, E) and in the post-contrast LGE images (heterogeneous pattern in C and F).

