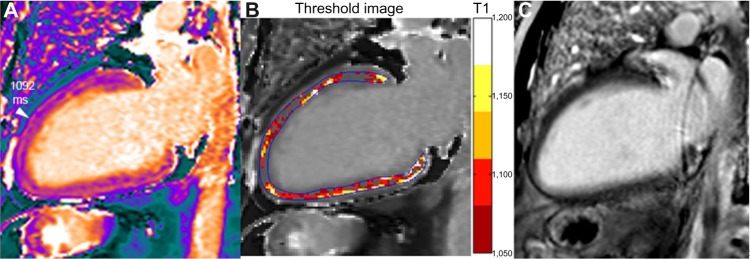
Figure 9.

A 62-year-old male with DCM and left bundle branch block (LVEDVI 135 mL/m2, EF 25% and normal coronary angiography). Small scattered slightly increased T1 areas are seen in the T1 map (A), but no corresponding abnormal area is seen in the LGE image (C). Signal measurement demonstrates overall T1 increase (1122 ms ie, +9% or +2.3 SD vs healthy myocardium). In contrast to the case of diffuse myocardial edema shown in Figure 5, T1 increase is not associated here with elevated T2 (in the range 51 ms), thus T1 augmentation is consistent with diffuse interstitial fibrosis. Mapping of pixels exceeding a threshold value (T1 >1050 ms in the example shown in B) demonstrates the extent and location of abnormal myocardial area (non-ischemic pattern distribution in this case with DCM).
