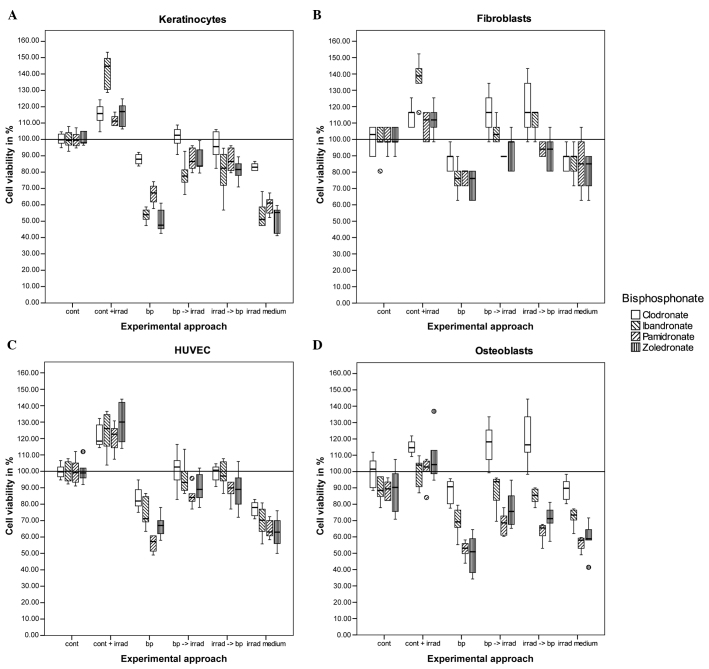
Figure 1.
Cell viability test (MTT) for (A) keratinocytes, (B) fibroblasts, (C) human umbilicord vein endothelial cells and (D) osteoblasts treated with bisphosphonates and irradiation. The black bar in the middle of each box represents the median. The box includes all the values between the 25th and 75th percentile. The whiskers indicate the values within the 1.5 interquartile range (IQR). The outliers within 3 IQR are represented as circles. Cont, control; cont + irrad, control + irradiation; bp, bisphosphonates only; bp → irrad, bisphosphonate incubation first followed by irradiation; irrad → bp, irradiation first followed by bisphosphonate incubation; irrad medium, irradiation of the bisphosphonate medium without cells.

