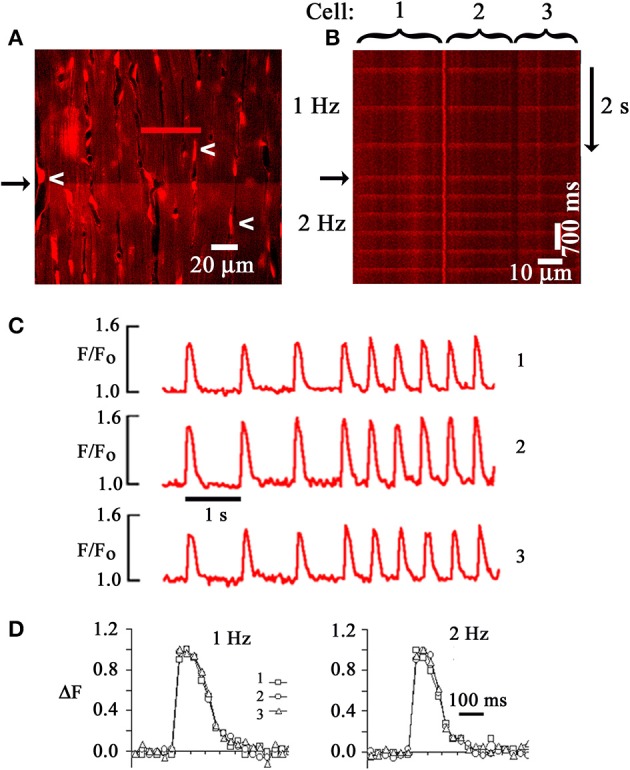
Figure 1.

Two-photon laser scanning microscopy-based imaging of action potential-evoked [Ca2+]i transients in the Langendorff-perfused mouse heart. (A) Frame-mode image of a rhod-2 loaded heart obtained from the left ventricular epicardium during two-photon excitation (810 nm). Emission was measured in the 560–650 nm range. White arrows point to endothelial cell nuclei. Cytochalasin D (50 μmol/L) was used to uncouple contraction from excitation. An electrical stimulus delivered at a point remote from the imaged area caused a simultaneous increase in rhod-2 fluorescence, i.e., [Ca2+]i, along the horizontal scan line (black arrow). (B) Line-scan image obtained by repeatedly scanning along the red line in (A) and stacking consecutive line scans vertically. The scan line traversed three neighboring cardiomyocytes. Periodic increases in rhod-2 fluorescence intensity correspond to [Ca2+]i transients evoked by propagating action potentials. Black arrow marks increase in pacing rate from 1 to 2 Hz. (C) time courses of spatially averaged rhod-2 fluorescence intensities (F) normalized to pre-stimulus F (Fo) for each of the three juxtaposed cardiomyocytes in (B). (D) Superimposed tracings of the changes in [Ca2+]i as a function of time for the three cardiomyocytes in (B). Normalized changes in F (ΔF) were obtained by dividing (F-F0) at each data point by the maximal (F-Fo). With permission from the American Physiological Society.
