Figure 6.
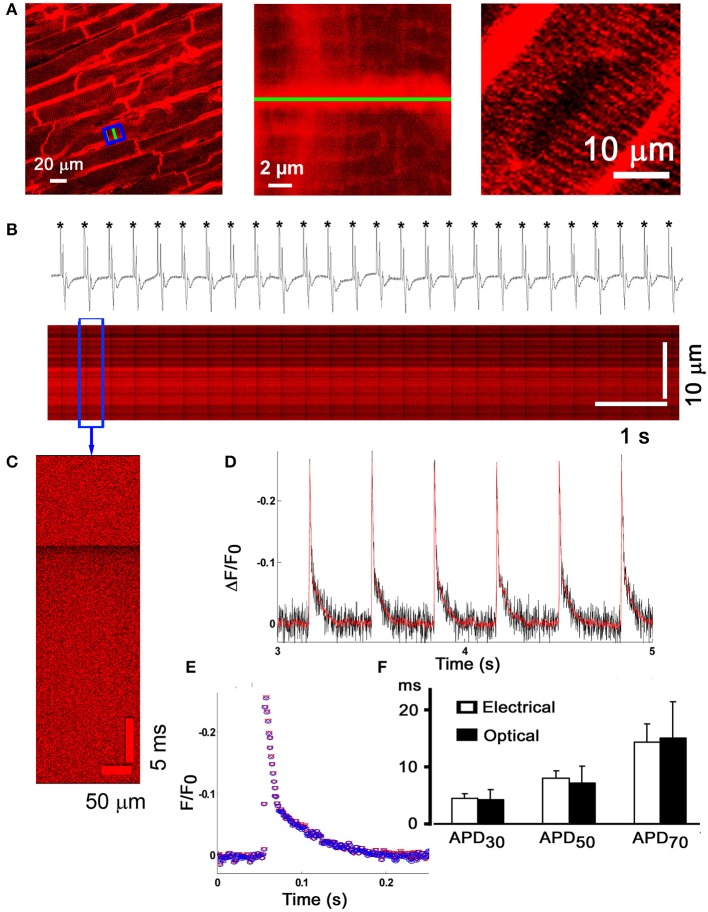
Micron-scale imaging of transmembrane voltage changes in the Langendorff-perfused mouse heart. (A) Frame-mode confocal image taken from the anterior left ventricular epicardial layer of a Langendorff-perfused mouse heart loaded with the fast-response voltage-sensitive dye Annine-6plus (left panel). The dye was excited at 488 nm and fluorescence emission was measured at >560 nm. Cytochalasin D (50 μmol/L) and ryanodine (1 μmol/L) were present in the coronary perfusate to suppress motion. Middle panel, magnified view of the boxed area in (A), revealing dye accumulation in the t-tubular membranes (thin lines). Right panel, no staining of the nuclear envelope was detectable more than 3 h after dye loading. (B) Line-scan mode image acquisition of action potential-evoked changes in Annine-6plus fluorescence intensity. The green line in (A) (left and middle panel) was repetitively scanned at a rate of 1 kHz and successive lines were stacked horizontally. Periodic, sharp decreases in Annine-6plus fluorescence intensity occur in phase with the QRS complex in the simultanesously recorded volume-conducted ECG, indicating that they correspond to transmembrane voltage changes in response to propagating action potentials. (C) Expanded view of changes in normalized Annine-6plus fluorescence intensity during a single evoked action potential. (D) Plots of spatially averaged changes in normalized Annine-6plus fluorescence intensity derived from the line-scan in (B). Red line corresponds to the filtered signal (ref). (E) Superimposition of the ensemble average of all consecutive action potentials in the line-scan in (B) and the filtered signal of a single optical action potential. (F) Bar graphs comparing optically and electrically measured action potential durations. There were no significant differences for any of the three time points assessed. With permission from the Biophysical Society.

