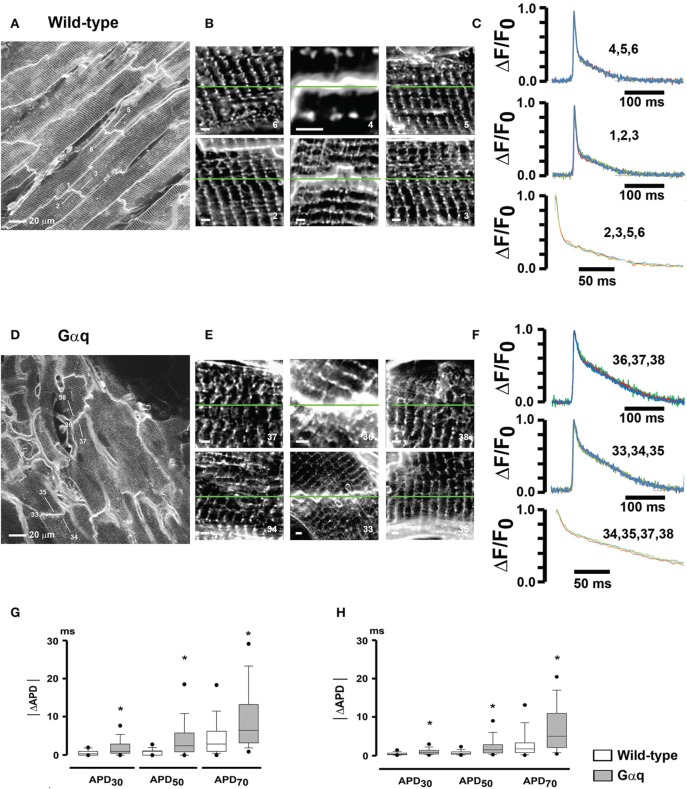
Figure 7.
Increased micro-heterogeneity in cardiomyocyte repolarization in hearts with pathological hypertrophy. (A,D) full-frame mode confocal images obtained from a wild-type heart (A) and a transgenic heart with cardiomyocyte-restricted overexpression of Gαq (D) loaded with Annine-6plus. Numbered white lines denote positions of line-scan mode acquisitions for action potential recording. (B,E) High-zoom 2D scans of areas centered in the correspondingly numbered line-scan positions in (A,D). Each image is composed of a square-shaped region with side length equal to the length of the respective action potential scan line. White scale bars, 5 μm. (C,F) Overlays of normalized optical action potentials recorded along the green lines in (B,E). Numbers above the trace refer to the numbers of the scan lines in (B,E). Stimulation rate was 3 Hz. Lower traces show overlays of 200-ms repolarization segments starting from the peak. Traces were filtered using moving average. (G) Box-and-whisker plots of absolute APD differences (|ΔAPD|) between individual cardiomyocytes within the same 225 × 225 μm2 acquired image frames. *P ≤ 0.001 vs. wild-type. (H) Electrically measured |ΔAPD| between individual cardiomyocytes within small microscopic (~500 μm in diameter) locations in the anterior left ventricular epicardial layers of wild-type and Gαq transgenic hearts. •P ≤ 0.005 vs. wild-type. With permission from Journal of Molecular and Cellular Cardiology.

