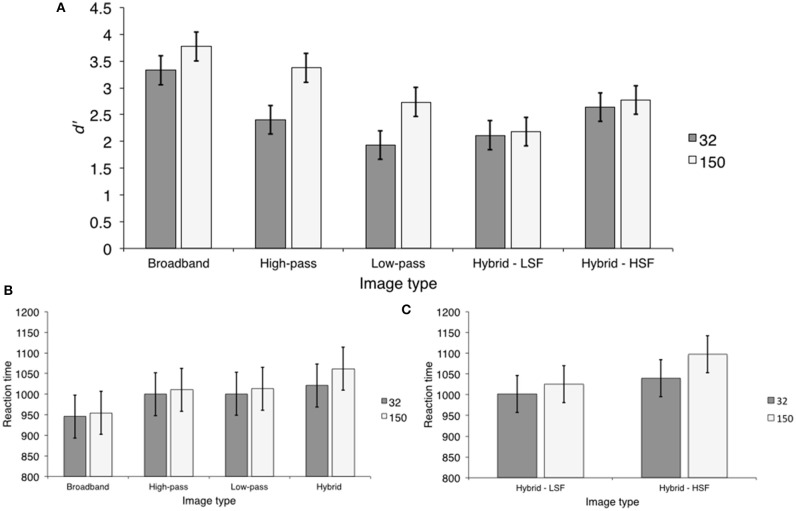
Figure 2.
The results of Experiment 1. (A) d′ values for each image type at each presentation duration. The error bars represented here, and throughout the manuscript are the 95% within-subject confidence intervals described by Loftus and Masson (1994); (B) Mean scene categorization RTs for each image type at each presentation duration; (C) Mean RTs for hybrid-LSF and hybrid- HSF categorization at each presentation duration.

