Figure 1.
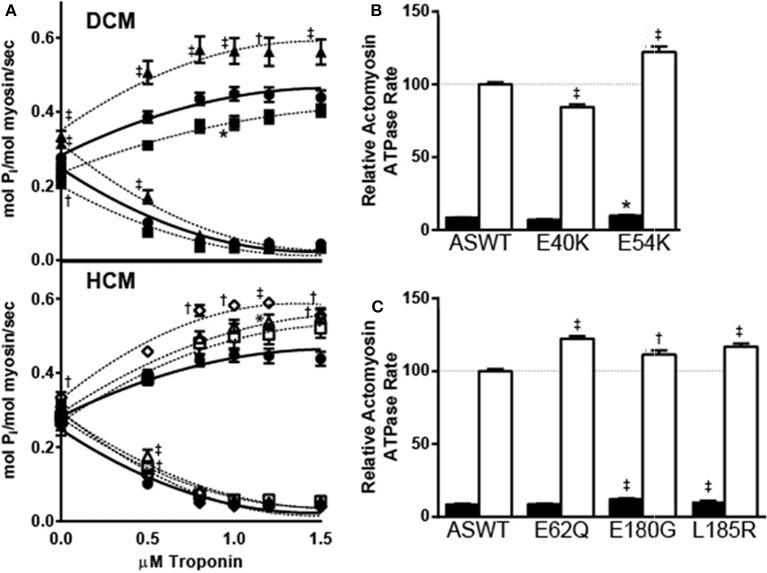
Effects of DCM and HCM Tm mutants on Tn concentration dependent actomyosin ATPase activity. (A) The Tn concentration-dependent ATPase rates of actomyosin samples prepared with ASWT and mutant Tms were compared. Tn was titrated from 0 to 1.5 μM into mixtures of 0.6 μM myosin, 3.5 μM actin, and 1 μM Tm, and the actomyosin ATPase activation at high (pCa 4) [Ca2+] (up-sloping) and inhibition at low (pCa 9.5) [Ca2+] (down-sloping) were measured for DCM (upper panel) and HCM (lower panel) associated mutations. The results represent the mean ± SE of calculated activity rates of experiments (n = 5) performed in triplicate. Samples graphed on DCM panel: ASWT (filled circle), E40K (filled square), E54K (filled triangle); on HCM panel: ASWT (filled circle), E62Q (open diamond), E180G (open square), L185R (open triangle). The maximal ATPase activity values of ASWT and DCM-associated (B) and HCM-associated (C) mutant Tm reconstituted actomyosin solutions in low (pCa 9.5; filled bar) and high (pCa 4; open bar) [Ca2+] were compared. Relative rates shown graphed are a percentage of the mean high [Ca2+] activated ASWT rate obtained from mixtures of 0.6 μM myosin, 3.5 μM actin, 1 μM Tm, and 1–1.5 μM Tn. Mean percentages ± SE were graphed; n = 20. Statistical significance were determined by ANOVA followed by Dunnett's multiple comparisons test; *p < 0.05, †p < 0.01, ‡p < 0.001.

