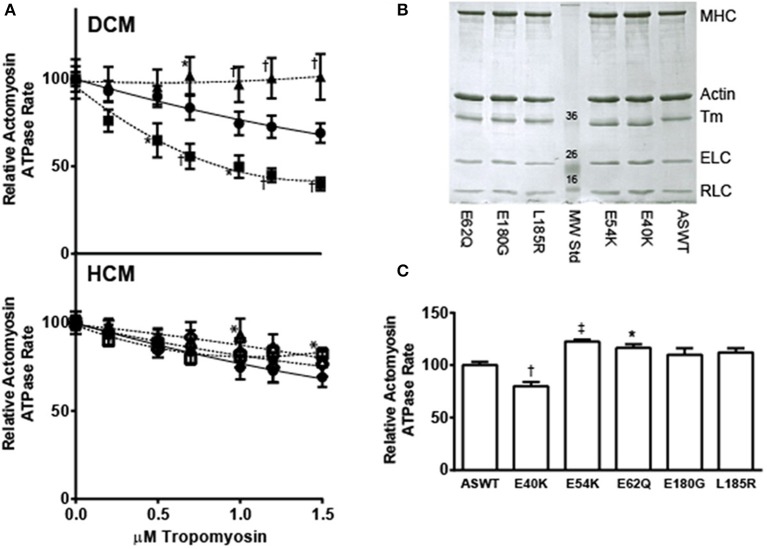
Figure 2.
Effects of DCM and HCM-associated mutations on Tm-dependent inhibition of actomyosin ATPase activity. (A) The effects of Tm concentration dependent inhibition of actomyosin ATPase activity were compared between ASWT and DCM (upper panel) and HCM (lower panel) associated mutants. Tm was titrated from 0 to 1.5 μM into solutions of 0.6 μM myosin and 3.5 μM actin, in low Ca2+ (pCa 9.5) buffer, and the actomyosin ATPase activity measured. The results represent mean ± SE of activity rates normalized to the maximum ATPase activity at 0 μM Tm. All samples were measured in triplicate; n = 5. Samples graphed on DCM panel: ASWT (filled circle), E40K (filled square), E54K (filled triangle); on HCM panel: ASWT (filled circle), E62Q (open diamond), E180G (open square), L185R (open triangle). (B) Coomassie stained SDS-PAGE analysis of Tm titration study samples. Samples taken from actomyosin ATPase activity assay mixtures (0.6 μM myosin, 3.5 μM actin, 1 μM Tm) were run on a 12% SDS-PAGE gel, to confirm purity and proper ratios of proteins utilized in the Tm titration studies. (C) Comparison of relative ATPase rates in the presence of 1 μM Tm. All samples were measured in triplicate; n = 16. Statistical significance were determined by ANOVA followed by Dunnett's multiple comparisons test; *p < 0.05, †p < 0.01, ‡p < 0.001.

