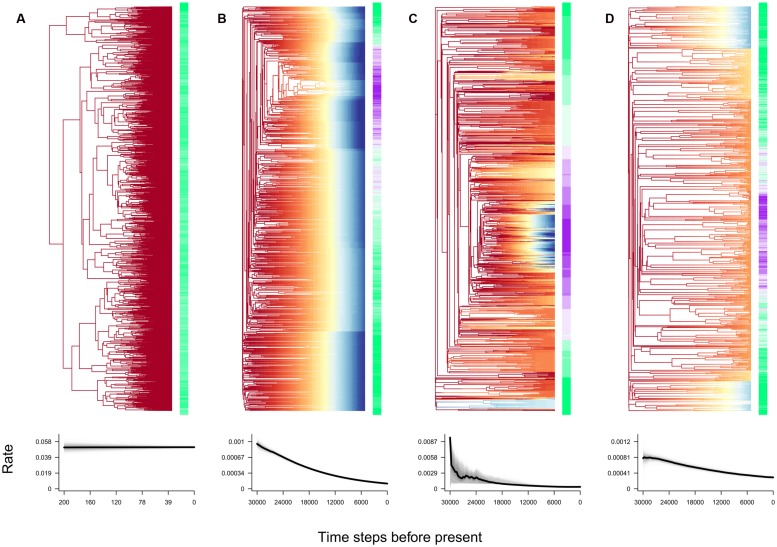
FIGURE 2.
Output from Bayesian analysis of macroevolutionary mixtures (BAMM) analysis of four distinct diversification scenarios. (A) Pure niche conservatism, (B) energy gradient, (C) speciation gradient, and (D) disturbance gradient. Top row, extant phylogenies at t = 200 time steps (A), or t = 30,000 time steps (B–D). Branches are color coded by instantaneous estimates of speciation rate, from low (blue) to high (red). Color labels at the tips reflect the geographic region of maximum abundance for each species, from temperate regions (purple) to tropical regions (green). Bottom row, estimated median speciation rate over the time course of diversification under each scenario.

