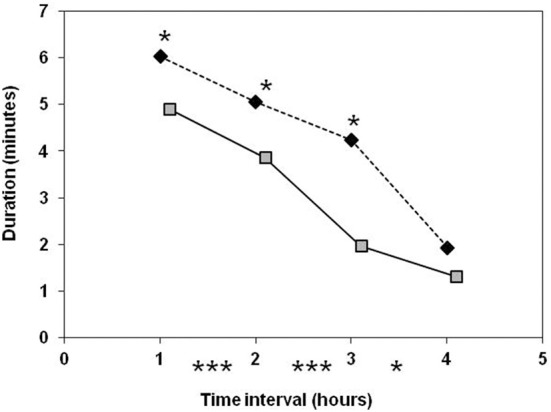
Figure 4.

Comparison of old-type sows (♦) and modern-type sows ( ) for rooting activity during the first 4 h after the onset of farrowing. Significance levels below the X axis refer to differences between successive periods of time, obtained with both lines merged together. Significance levels reported on the graph above mean values refer to line differences: *P < 0.05; ***P < 0.001.
