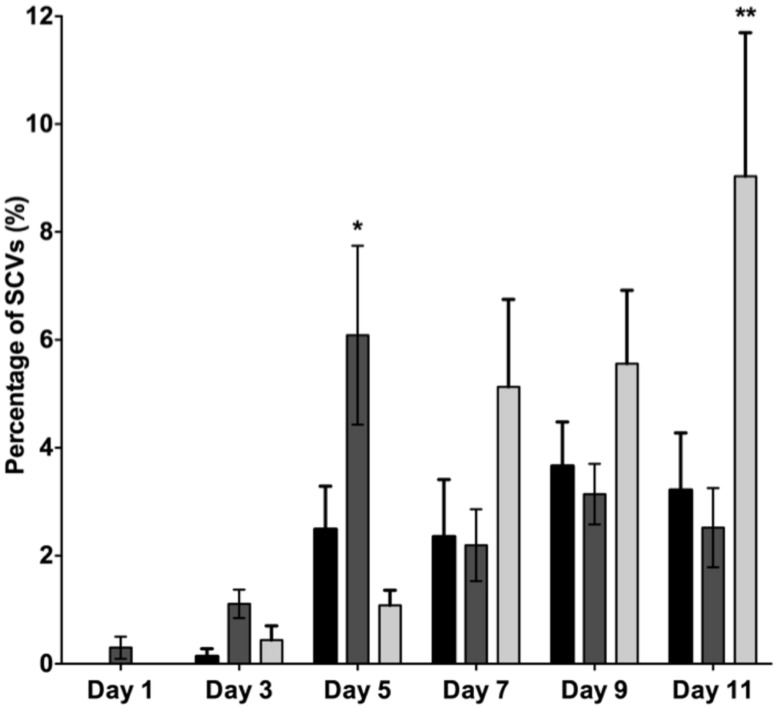
FIGURE 6.
The percentage of SCVs in the biofilm dispersal population for PAO1 WT (black bars), the mutS mutant (dark gray) and the recA mutant (light gray). Data are means of three experiments and the error bars indicate SE of the mean. (*) and (**) indicate a statistically significant difference when compared to PAO1 WT at 95 and 99% confidence intervals respectively, as determined by using a one-way ANOVA.

