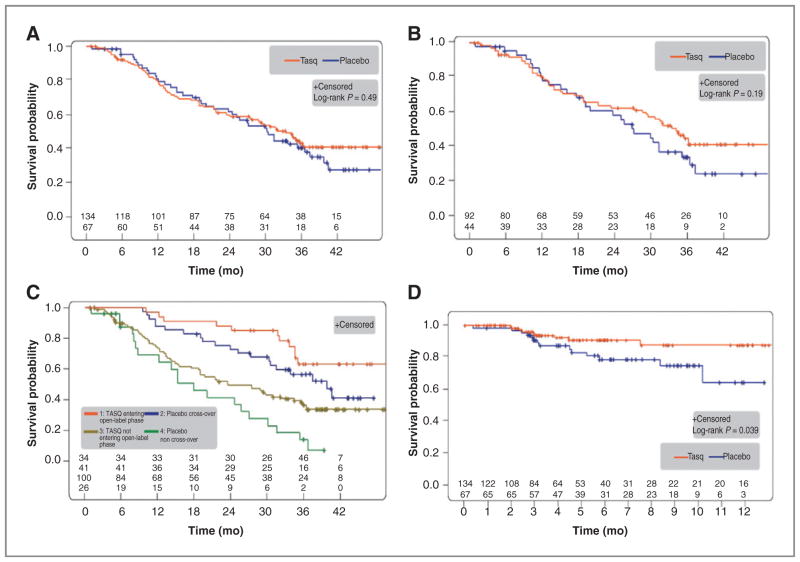
Figure 1.
OS and time to symptomatic progression. A, overall survival in the ITT population with median OS 33.4 versus 30.4 months (P = 0.49; HR, 0.87; 95% CI, 0.59–1.29; n = 201; tasquinimod/placebo n = 134/67; events = 71/40). B, OS in the bone-metastatic disease subgroup identified by PCWG2 with median OS 34.2 versus 27.1 months (P = 0.19; HR, 0.73; 95% CI, 0.46–1.17; n = 136; tasquinimod/placebo n = 92/44; events = 47/28). C, OS in subgroups based on open-label treatment, that is, tasquinimod entering open-label/placebo cross-over/tasquinimod not entering open-label/placebo non–cross-over n = 34/41/100/26. Events = 11/20/60/20; median OS = not reached/39.6/23.4/17.8 months, n = 201. D, time to symptomatic progression in the ITT population. Number of events tasquinimod/placebo n = 9/14; HR, 0.42; 95% CI, 0.18–0.98; P = 0.039.

