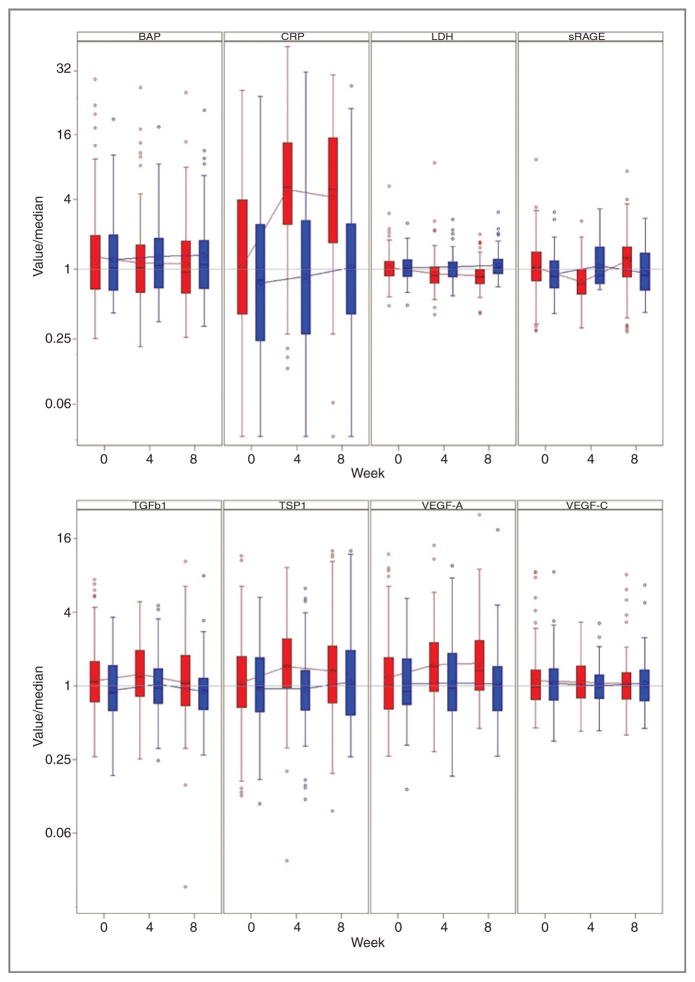
Figure 3.
Normalized box-plot analyses of the biomarkers bone alkaline phosphatase (BAP), C-reactive protein (CRP), LDH, TGFβ-1, TSP-1, VEGF-A, VEGF-C, and sRAGE over time of the double-blind part of the study (baseline, week 4, and week 8). The median baseline values for the biomarkers were (tasquinimod/placebo): BAP (20.9/21.3 μg/L), CRP (3.0/2.4 mg/dL), LDH (202/206 U/L), TGF-β1 (5940/4820 ng/L), TSP-1 (1410/1330 μg/L), VEGF-A (45.3/40.2 μg/L), VEGF-C (740/799 ng/L), and sRAGE (1280/1060 ng/L). Red refers to tasquinimod treatment whereas blue refers to placebo.

