
Figure 2. Anatomical Abnormalities in Juvenile 16p11+/− Mice.
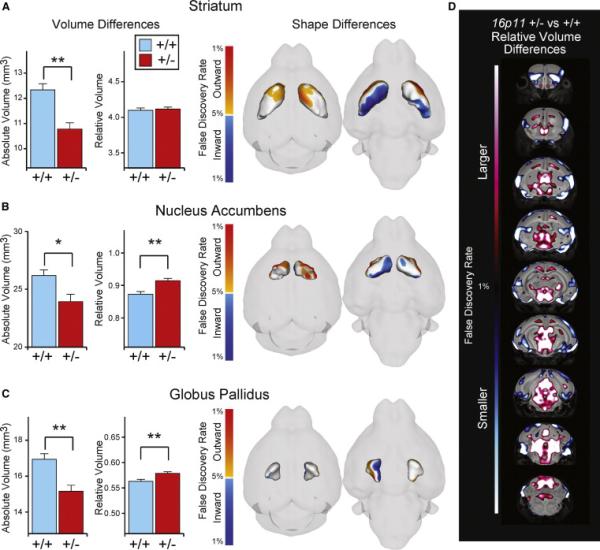
MRI analysis of mouse brains at P7 (n = 26 for each genotype).
(A–C) Volume and shape difference are displayed for the BG regions, namely, the striatum (A), GP (B), and NAc (C). Volumes in (A)–(C) are shown as both absolute (in mm3) and relative volumes. Shape differences in (A)–(C) show 3D surface renderings of the given region of interest. Highlighted on that surface are significant shape differences (q < 0.05) between the 16p11+/− mouse and control. Orange, outward movement; blue, inward movement.
(D) Coronal flythrough highlighting significant differences in the relative volume of the 16p11+/− mouse and control (red: larger, blue: smaller); only highly significant areas are shown (q < 0.01). Error bars represent SEM. *q < 0.05, **q < 0.01.