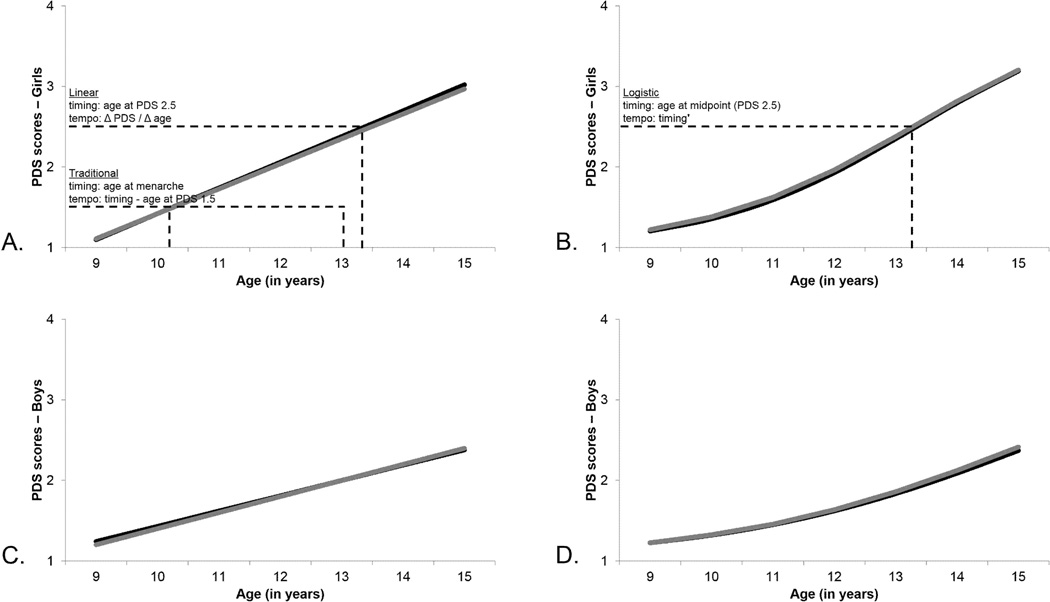
Figure 1.
Mean pubertal development trajectories (according to PDS scores) for girls and boys, with descriptions of how timing and tempo parameters were estimated; black lines are replicate 1, and gray lines are replicate 2. Figure 1A shows linear results for girls, providing a description of how linear timing and tempo parameters were estimated for both sexes; it also provides a description of how traditional timing and tempo parameters were estimated for girls. Figure 1B shows logistic results for girls, providing a description of how logistic timing and tempo parameters were estimated for both sexes, where timing' (timing prime) is the first derivative of timing. Figure 1C shows linear results for boys. Figure 1D shows logistic results for boys.

