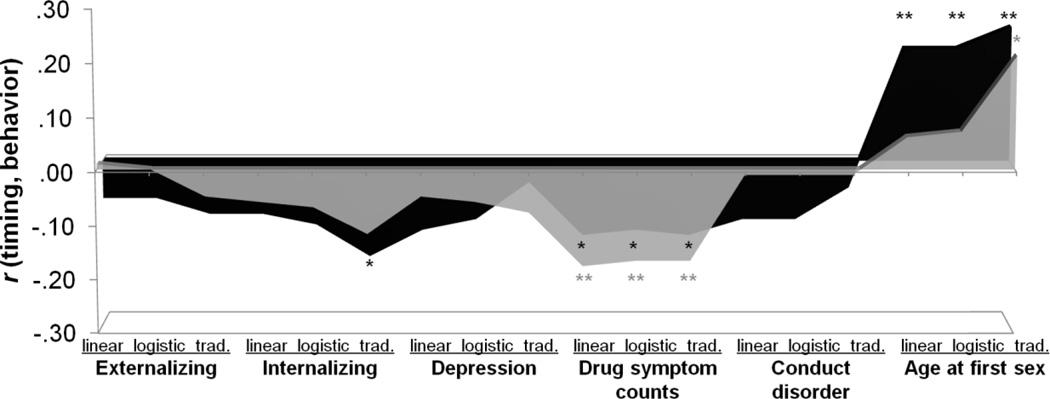
Figure 2.
Area graph of pubertal timing correlations with behavior for girls by method of assessment/point in puberty (linear model mid puberty, logistic model mid puberty, age at menarche), for each replicate. The black plot and asterisks are replicate 1 (range of N’s: 174–282); the gray plot and asterisks are replicate 2 (range of N’s: 153–277). Each peak reflects a discrete timing-behavior correlation; correlations significantly different from 0, * p < .05, ** p < .01; trad.: traditional.

