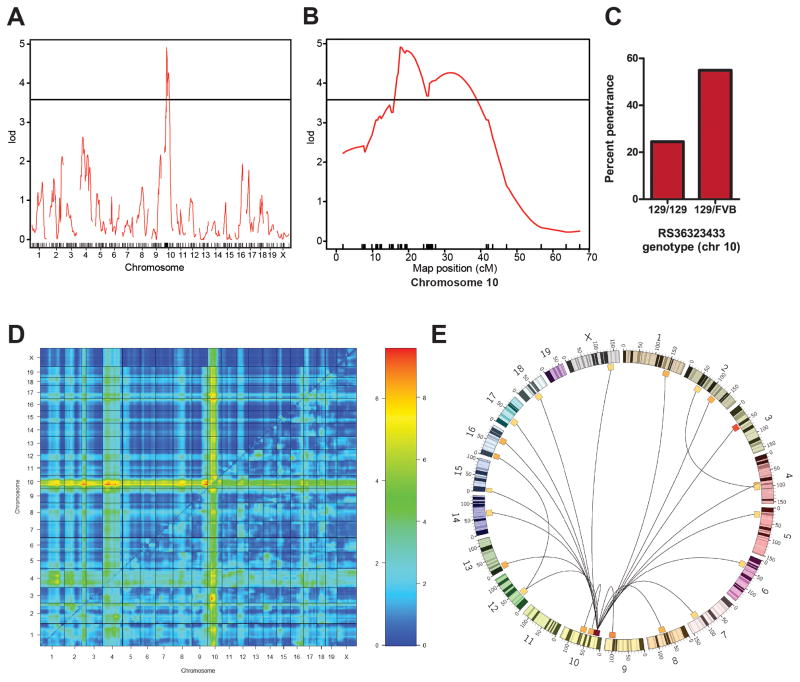
Figure 1. A locus on chromosome 10 and multiple secondary loci are linked to tumor susceptibility.
(A) LOD plot for tumor susceptibility shows a single significant locus on chromosome 10. Horizontal line indicates 5% genome-wide significance threshold (LOD=3.58, 1000 permutations). (B) LOD plot of chromosome 10 only. Hash marks on the horizontal axis indicate marker positions. Horizontal line indicates 5% genome-wide significance threshold (LOD=3.58, 1000 permutations). (C) Effect plot for the marker closest to the maximum LOD score (RS36323433) showing incidence of tumors as a function of genotype. (D) Two-QTL analysis using sex as an interacting covariate reveals that multiple secondary loci interact with the chromosome 10 locus. The top left half shows the results of the additive model, and the bottom right half shows results of the “full” model. The bar on the right displays the correspondence between color on the chart and LOD scores (the left side of the bar corresponds to the additive analysis on the top left half of the plot, while the right side of the bar, with a different scale, corresponds to the full model analysis on the bottom right). Locations of the maximum LOD scores are shown in Table S2. (E) Circos plot illustrating the two-way interactions showin in (D). Pairs of loci with a LOD greater than 6 are connected.

