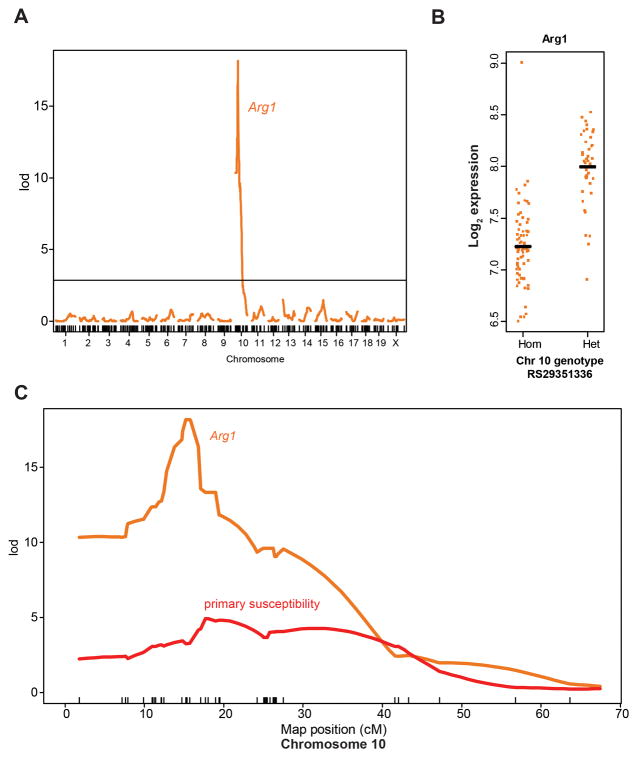
Figure 2. An eQTL for Arg1 co-localizes with the tumor susceptibility locus on chromosome 10.
(A) Interval mapping for Arg1 expression, the most significant eQTL in the chromosome 10 region, showing a LOD score of 18.2 on chromosome 10, centered at the physical location of the Arg1 gene. Horizontal line indicates 5% genome-wide significance threshold. (B) Log2 Arg1 expression level as a function of genotype at SNP RS29351336 on chromosome 10. (C) A plot of LOD scores on chromosome 10 for susceptibility (red line) and the Arg1 eQTL (orange line) showing co-localization of the peaks.

