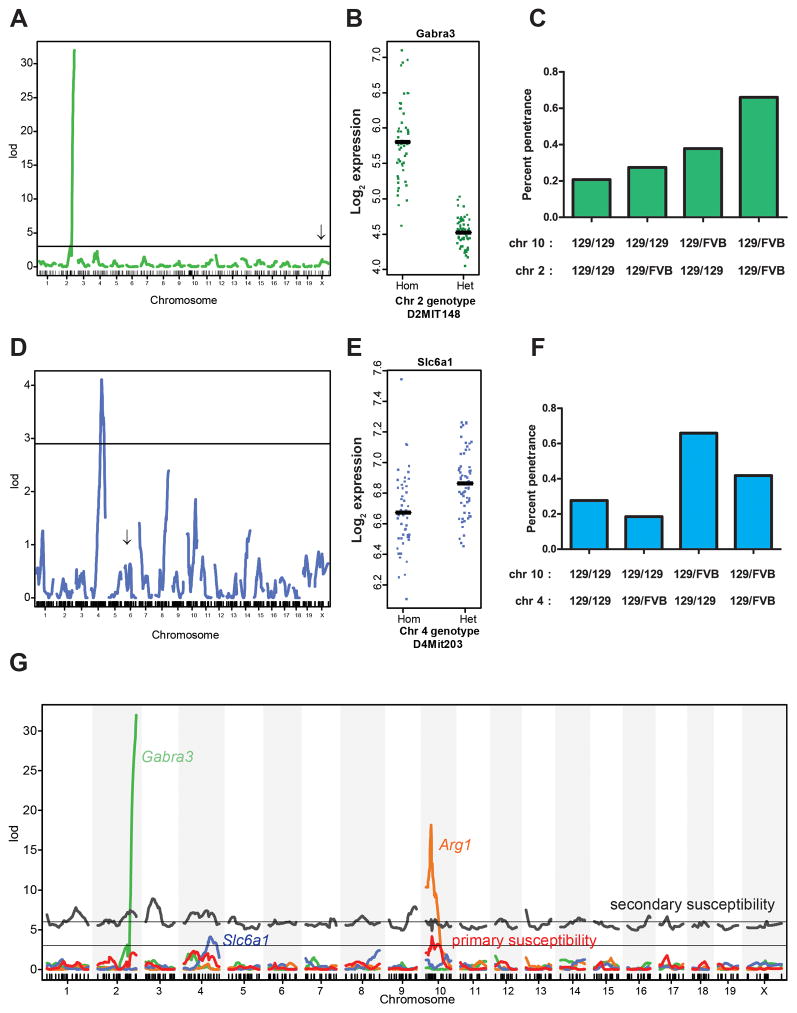
Figure 3. Secondary susceptibility loci co-localize with eQTL for GABA-related genes.
(A) A trans-eQTL on chromosome 2 controls expression of the GABA-A receptor subunit 3 (Gabra3) on the X chromosome (arrow) (LOD=30.9). (B) Gabra3 expression as a function of D2MIT148 genotype. (C) Plot of tumor incidence as a function of genotypes at the chromosome 2 and 10 loci. (D) Expression QTL for the Slc6a1 GABA transporter on chromosome 4 (LOD=4.1). Arrow indicates the physical location of Slc6a1 on chromosome 6. (E) Slc6a1 expression as a function of D4MIT203 genotype. (F) Tumor incidence as a function of genotypes at loci on chromosomes 4 and 10. (G) Genome-wide plot of LOD scores for the Gabra3 (green), Slc6a1 (blue), Arg1 (orange) eQTL and tumor susceptibility for a single-locus model (red) and the combined effect of the peak of the chromosome 10 locus plus points across the rest of the genome (gray), showing correspondence between eQTL peaks and primary and secondary susceptibility loci. Two-dimensional plots for Gabra3 and Slc6a1 are shown in Figure S3.

