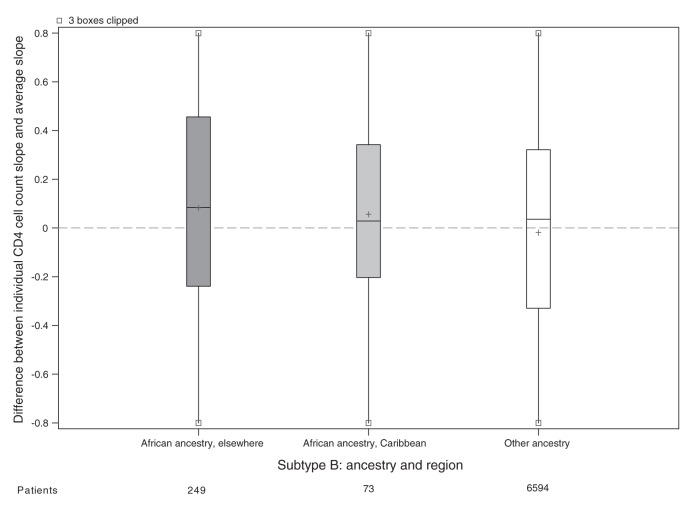
Figure 3:
Estimated decline in CD4 cell count slope for each patient with viral subtype B. Random effects represnting each patient’s CD4 cell count decline (compared with the average) estimated in a mixed model without ethnicity or subtype slope parameters but adjusted for covariates. All cohorts are represented in the model except Aquitaine; however, the only patients shown in this plot have HIV subtype B. Grey shading = patients of African ancestry, white shading = patients of other ethnicities, + = mean.

