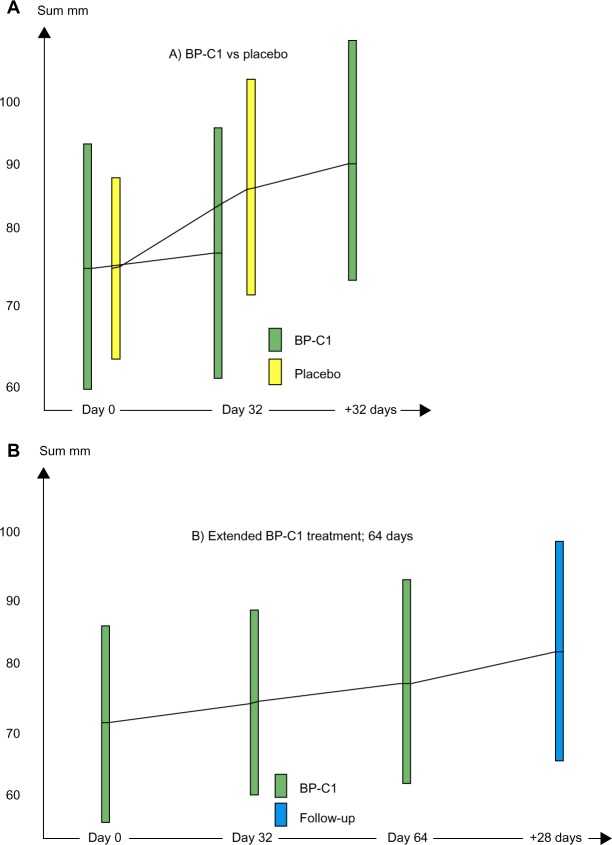
Figure 2.
The development in sum of the largest diameters of target lesions, in millmeters.
Notes: Results are expressed by mean values with 95% confidence intervals illustrated by columns. The green bars show BP-C1, the yellow bars show placebo, and the blue bar shows results after 28 days of follow-up. (A) BP-C1 versus placebo followed by BP-C1 treatment. (B) Extended 64 days of BP-C1 treatment.
Abbreviation: BP-C1, benzene-poly-carboxylic acids complex with cis-diammineplatium (II) dichloride.

