Figure 1.
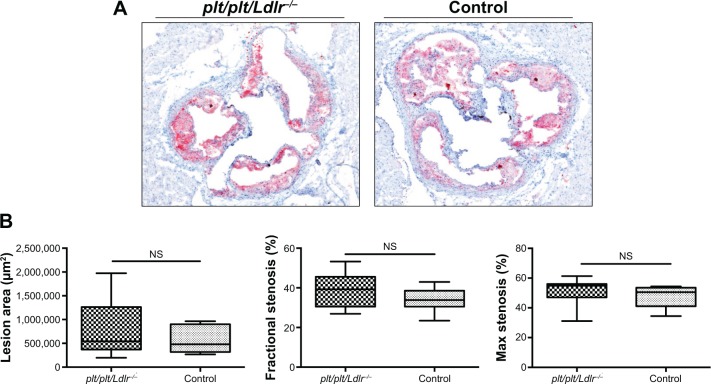
No changes on plaque burden in plt/plt/Ldlr−/− mice.
Notes: Representative photomicrographs of Oil Red O immunostaining from aortic roots of plt/plt/Ldlr−/− mice (n=9) and control group (n=9) are shown at 4× magnification (A) Quantitative analysis of lesion area (μm2), fractional stenosis (%), and maximum stenosis (%) (B). Results are presented as box plots displaying means and 25th and 75th percentiles as boxes and 10th and 90th percentiles as whiskers.
Abbreviation: NS, not significant.

