Figure 2.
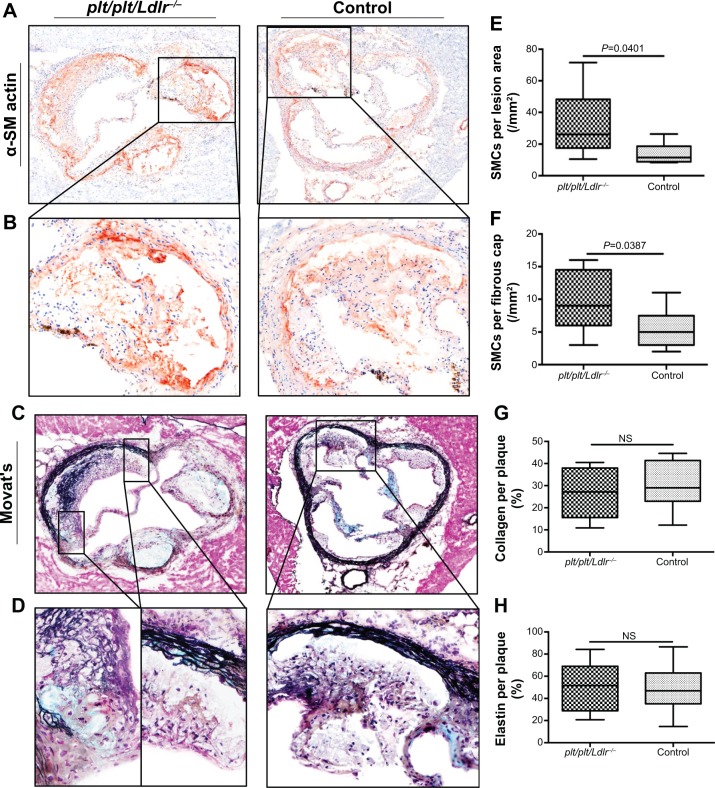
Higher plaque stability in plt/plt/Ldlr−/− mice.
Notes: Representative photomicrographs of immunohistochemistry stainings of smooth muscle cells (SMCs; α-SM actin, red staining [A, B]) and collagen and elastin (Movat’s staining, [C, D]) from aortic root of plt/plt/Ldlr−/− mice (n=9) and control group (n=9). Magnification (10×) of photomicrographs of A and C are shown in B and D. Quantitative analysis of the number of smooth muscle cells in the whole lesion area (E) and in the region of the fibrous cap (F). Collagen and elastin were calculated as percentage of Movat’s+-stained plaque area to total lesion area (G + H). The quantitative data are presented as box plots displaying means and 25th and 75th percentiles as boxes and 10th and 90th percentiles as whiskers (E–G).
Abbreviation: NS, not significant.

