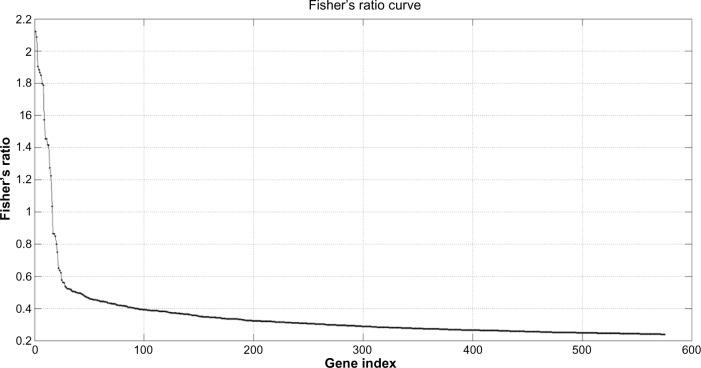
Figure 4.
Fisher’s ratio curve for the Low Fatigue-High Fatigue phenotype discrimination. Genes with the highest Fisher’s ratio were the most important biological eigenvectors for the phenotype discrimination, as it happens, for the Fourier analysis of a digital signal and its decomposition into different harmonics. In this case, the Fisher’s ratio curve decreases very steeply, in such that only with the first set of genes (14 to 35 genes in this case) can the highest discriminative accuracy of the learning data set, can be achieved. Adding genes with lowest discriminatory power indiscriminately does not improve the LOOCV predictive accuracy. The backward RFE method is used to determine the amount of details that is needed.

