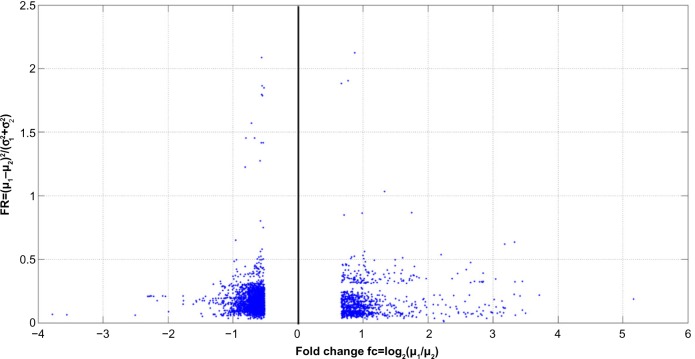
Figure 5.
Fold change-Fisher’s ratio plot of genes in the learning dataset with absolute fold change greater than 0.52 that corresponds to the 0.005 and 99.5% tails of the fold change distribution. In this case the Fisher’s ratio plays a similar role than −log(P value) for the volcano plot analysis.30

