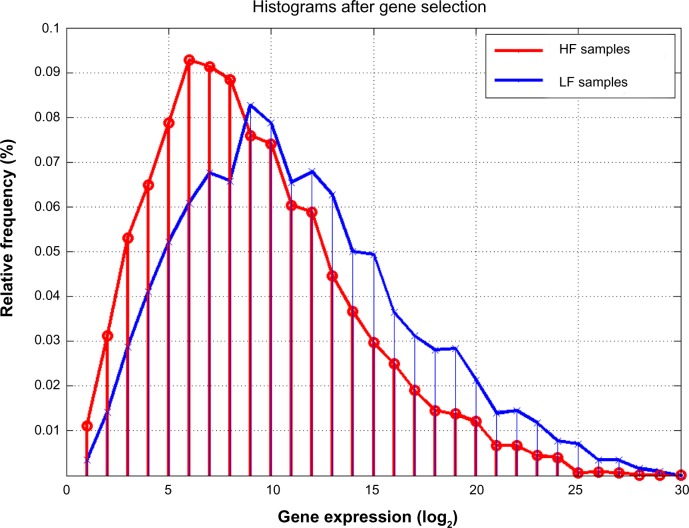
Figure 7.
Histograms (in log2 scale) for the Low Fatigue (LF) and High Fatigue (HF) patients, of the first 360 most discriminatory genes. Compared to Figure 3, a higher discrimination in the modes of the LF/HF phenotypes can be observed: the mode of HF samples is shifted to lowest values (approximately 64 instead of 512).

