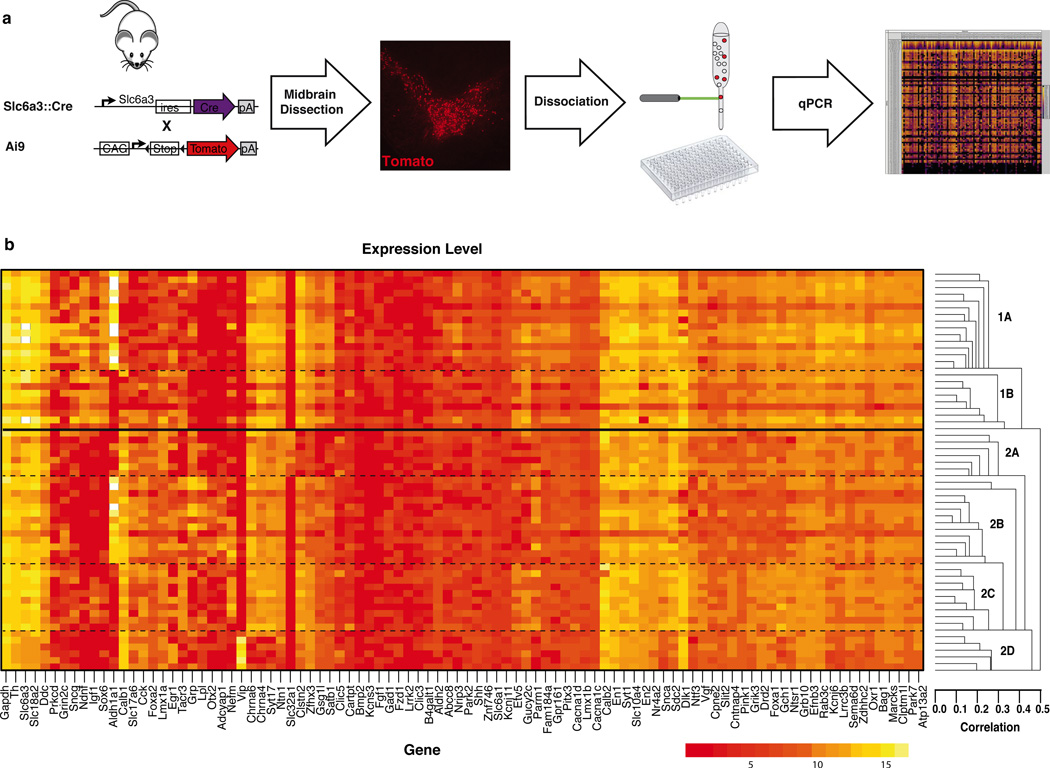
Figure 1. High throughput single-cell gene expression analysis of midbrain dopamine neurons.
(a) The midbrain of postnatal day four Slc6a3::Cre; Ai9 midbrain was dissected and dissociated. Fluorescent (tdTomato+) single cells were FACS sorted into 96-well plate and analyzed for the expression of 96 genes using Fluidigm Biomark system. (b) A sample array in which the expression level of each gene is depicted on a logarithmic scale with red indicating low expression and yellow representing a high expression. Unbiased clustering analysis revealed the presence of two main clusters that could be further divided into a total of six molecularly distinct dopamine (DA) neuron subtypes.

