
Figure 6.
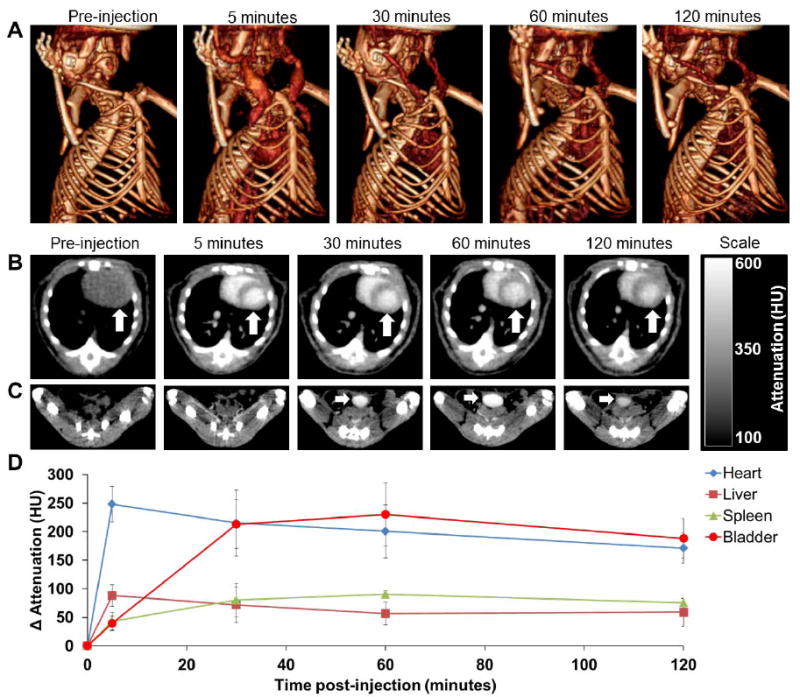
In vivo CT imaging of mice injected with BION (Bi-30). A) 3-D volume rendered CT images of a mouse, pre- and 5, 30, 60 and 120 minutes post-injection. B) CT images of a mouse thorax acquired at different time points; the arrow indicates the heart. C) CT images of mouse groin acquired at different time points; the arrow indicates the bladder. D) CT attenuation change of different organs over time, post-BION injection. Error bars are standard deviations.